AEWM Wealth Report: Sell in May and Go Away?

Download PDF Version
Some investors choose to exit the market for several months each year when performance is expected to be flat. What could be the merits — and flaws — of this tactic?
Overview
There’s a catchy phrase that gets tossed around in the investment world around this time of year: “Sell in May and go away.” It’s based on the perception that the stock market tends to take a bit of a breather during the summer months and either underperforms or remains flat.1
While historical data shows varied performance during the summer months, it’s important to approach this idea with caution. Many justify this idea because the summer months are when people tend to take vacations, so there is less volume trading among individual investors, stockbrokers and institutional managers. And there is historical data to support lackluster performance in the summer months. For example, from 1957 to 2024, the S&P 500 averaged returns of 0.3% in May, 0.1% in June and 1.1% in July — well under the annual average return rate of 10.13%.2 Bear in mind that these are average returns over a 67-year timeframe — and averages, by definition, even out the ups and downs that occur from month to month and year to year.
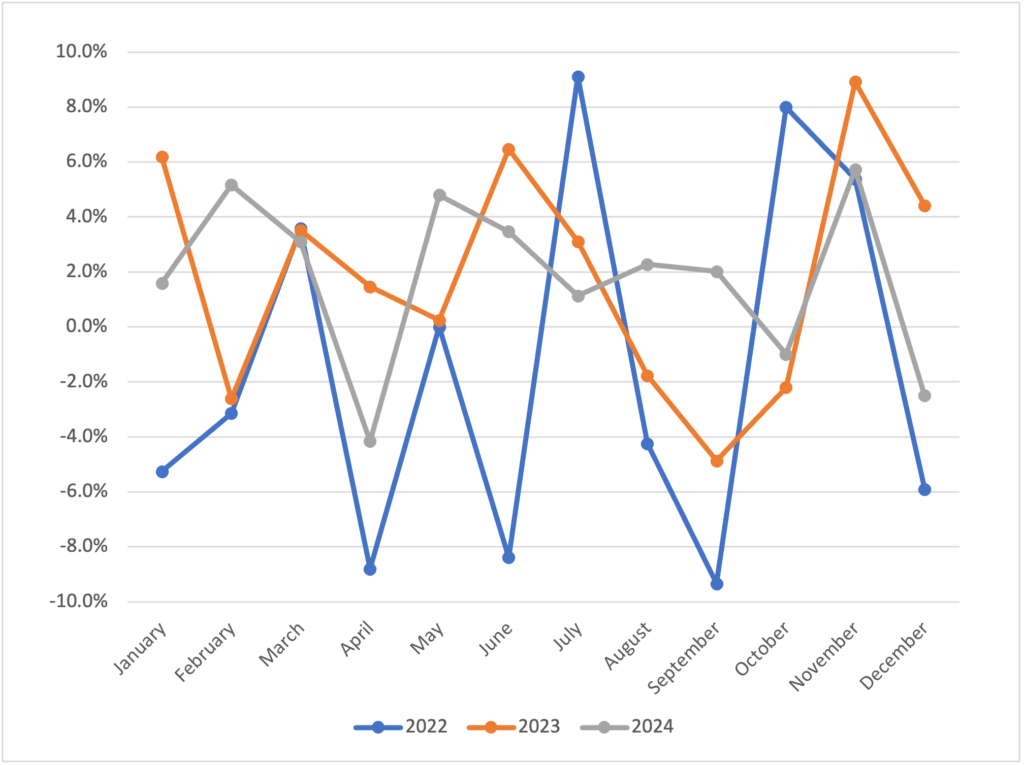
To get an idea of what monthly performance looks like, the accompanying line graph illustrates the S&P 500’s monthly returns over the past three years:
Compare S&P 500 Monthly Returns: 2022, 2023 and 20243
The S&P 500 Utilities Index is a market-value-weighted index that measures the performance of all stocks within the utilities sector of the S&P 500 Index.
When you look at this graph, let your eyes run up and down for each month from May to October. You can see that in just the past three years, there has been a substantial variation in returns throughout the year — not just the summer months.
Seasonal Performance
This isn’t to say there aren’t commonalities in seasonal stock market performance. It’s true that summer months yield less trading volume. It’s also true that some stocks tend to outperform in cooler weather months from November through April, such as in the consumer discretionary, industrials, materials and technology sectors.
According to the Center for Financial Research and Analysis (CFRA), cyclical sectors, on average, tend to outpace defensive sectors during the winter months. But the opposite is also true. The CFRA reports that defensive sectors (e.g., consumer staples, health care, utilities, etc.) tend to outperform from May through October.4
But should we get lulled into the notion that the market tends to pick up steam in November of each year (a phenomenon known as the “Halloween effect”), there may be a good reason why those average monthly returns from November to April look so good over a long timeframe. October is a notorious month for stock market crashes; the bank panic of 1907, the stock market crash of 1929 and “Black Monday” in 1987 all happened during October.
Also note that October precedes the U.S. nationwide Election Day every other year, another catalyst of seasonal volatility. It stands to reason that a month directly following one that tends to experience volatility will likely post higher returns.
Alternative Investment Strategies
Clearly, there are pros and cons to pursuing a “sell in May and go away” strategy. However, there are a few other strategies investors can deploy to help better position their portfolios and take advantage of seasonal market opportunities:
Sector Rotation
Instead of selling to cash in May, an investor might consider selling and reinvesting stocks in more defensive sectors, then rotating back out in autumn.
Active vs. Passive Management
The “go away” tactic implies that an investor adheres to a passive investment strategy. In other words, for part of the year, they “buy and hold” but sell and stay out of the market for the other part of the year. An alternative is to engage in active investment management, in which the investor continually monitors his or her portfolio throughout the year and makes changes based on economic factors and stock market trends.
This is pretty much the opposite of “going away” because it requires discipline and due diligence. Many investors choose to engage with a wealth manager to manage their portfolio with an active investment strategy rather than try to do it themselves.
Dollar-Cost Averaging
There is a passive way to buy when share prices dip without having to actively monitor the market. Automatic investing takes advantage of dollar-cost averaging (DCA), which is simply investing the same amount of money on a regular basis regardless of market performance. Most people do this through salary deferrals to their employer-sponsored retirement plans, such as a 401(k) or 403(b). Those contributions buy more shares when prices drop and fewer shares when prices rise.5
The benefit of DCA is that the cost basis of the total investment generally reduces over time. It also takes the guesswork out of when to invest.
No Harm, No Foul?
Is there any real harm in selling in May and going away? There could be. It depends on how the market performs in subsequent months — and we all know there’s no way to predict what will happen. The “sell in May” strategy is basically a form of market timing, an investment strategy in which an investor attempts to jump in and out of the market based on consumer trends, share prices, market momentum and economic factors.
Investors, even professional money managers, are not able to navigate these variables with much success over long periods, and financial advisors typically do not advocate market-timing strategies. It’s also important to recognize that stocks tend to improve performance cumulatively over the years, so hopping in and out of the market for days or months at a time can stymie this trajectory.
Consider this: The S&P 500 stock index averaged an 8% annual return between 1993 and 2023. Investors who missed the market’s 10 best days during that time saw returns of 5.26%, while investors who missed the 30 best days saw their average returns reduced to just 1.83%.6
An investor who remained in the market throughout the entire period would have earned significantly more than one who tapped out during the market’s best days. The accompanying table illustrates how much in earnings the investor lost if they used the “sell and go away” strategy.
This hypothetical example is used for illustrative purposes only and does not reflect the performance of any specific investment. This example does not take into consideration any investment fees and expenses or the effect of taxes on distributions.
Missing only the best days over a 15-year period may seem unlikely, but as a point of reference, refer back to the first line graph to see the best-performing months in the past three years:7
- 2022 – July, October, November
- 2023 – January, June, November
- 2024 – February, May, November
In 2022 and 2023, an investor who sold in May and went away would have missed some of the strongest returns during the summer months. And if you sold early in May 2024, you may have missed out on returns later in the month. It’s another reminder that we can’t predict when the “best days” will occur.
Finally, in addition to market performance opportunity, consider the costs associated with “sell in May.” These may include trading expenses and taxes on short-term capital gains in a taxable account.
Final Thoughts
As with most investment strategies, there can be advantages to the “sell in May and go away” tactic. What is important is that each investor develops a portfolio management style that appropriately reflects their financial goals, risk profile and timeline. Exiting the market a few months at a time may be more fitting for an active investor with a shorter investment horizon.
However, maintaining a diversified portfolio with a customized asset allocation — which may or may not include an active trading component — is a lower-risk and well-trodden path for retirement planning. Speak with an experienced financial professional to help determine which investment strategies best suit your circumstances.
SOURCES
1 Troy Segal. Investopedia. March 10, 2025. “‘Sell in May and Go Away’”: Definition, Statistics, and Analysis.” https://www.investopedia.com/terms/s/sell-in-may-and-go-away.asp. Accessed April 3, 2025.
2 J.B. Maverick. Investopedia. Dec. 26, 2024. “S&P 500 Average Returns and Historical Performance.” https://www.investopedia.com/ask/answers/042415/what-average-annual-return-sp-500.asp. Accessed April 3, 2025.
3 YCharts. “S&P 500 Monthly Return (I:SP500MR).” https://ycharts.com/indicators/sp_500_monthly_return. Accessed April 3, 2025.
4 Fidelity. April 25, 2024. “Should you ‘sell in May?’” https://www.fidelity.com/viewpoints/active-investor/sell-in-may. Accessed April 3, 2025.
5 Adam Hayes. Investopedia. May 23, 2024. “Dollar-Cost Averaging (DCA) Explained With Examples and Considerations.” https://www.investopedia.com/terms/d/dollarcostaveraging.asp. Accessed April 3, 2025.
6 Greg Iacurci. CNBC. March 7, 2024. “Bailing on the stock market during volatility is a ‘loser’s game,’ financial advisor says. Here’s why.” https://www.cnbc.com/2024/03/07/why-bailing-on-the-stock-market-is-likely-a-losers-game-cfp-says.html. Accessed April 3, 2025.
7 YCharts. “S&P 500 Monthly Return (I:SP500MR).” https://ycharts.com/indicators/sp_500_monthly_return. Accessed April 3, 2025.
Any references to guarantees or lifetime income generally refer to fixed insurance products, never securities or investment products. Insurance and annuity product guarantees are backed by the financial strength and claims-paying ability of the issuing insurance company.
Investing involves risk, including the potential loss of principal. No investment strategy can guarantee a profit or protect against loss in periods of declining values.
This content is provided for informational purposes. It is not intended to be used as the sole basis for financial decisions, nor should it be construed as advice designed to meet the particular needs of an individual’s situation. None of the information contained herein shall constitute an offer to sell or solicit any offer to buy a security. Individuals are encouraged to consult with a qualified professional before making any decisions about their personal situation. The information and opinions contained herein provided by third parties have been obtained from sources believed to be reliable, but accuracy and completeness cannot be guaranteed by AE Wealth Management. Neither AEWM nor the firm providing you with this report are affiliated with or endorsed by the U.S. government or any governmental agency. AE Wealth Management, LLC (AEWM) is an SEC Registered Investment Adviser (RIA) located in Topeka, Kansas. Registration does not denote any level of skill or qualification. The advisory firm providing you this report is an independent financial services firm and is not an affiliate company of AE Wealth Management, LLC. AEWM works with a variety of independent advisors. Some of the advisors are Investment Adviser Representatives (IARs) who provide investment advisory services through AEWM. Some of the advisors are Registered Investment Advisers providing investment advisory services that incorporate some of the products available through AEWM. Information regarding the RIA offering the investment advisory services can be found at http://brokercheck.finra.org.
4/25-4385001